Geography
85
Applications on GeoSpatial Technology
Lecture 5 - Introduction to Remote Sensing
Remote sensing is defined as the art and science of obtaining information about an object without being in direct contact with that object. What that means in layman terms is that gathering information about the landscape is often gathered remotely via aircraft or satellites in the form of imagery, such as aerial photographs, satellite photographs, or satellite sensored data that can detect parts of the electromagnetic spectrum that we cannot see with the naked eye. More on this later.
Conventional Imagery and Photogrammetry
Photogrammetry is the art and science of making accurate measurements by means of aerial photography. The most basic is a black & white (called panchromatic) image. This is very useful to show landcover (forests, grasslands, wetlands) and urban boundaries, which can be digitize from this image on screen or off. Color aerial photos can be used to classify clusters of geographic features such as vernal pools, oak savannas, riparian vegetation, agriculture types, etc. Both are dependent upon resolutions (given as meters or feet per pixel) and horizontal accuracy (i.e. how well does the image match real-world coordinates). The accompanying article Imagery for the Rest of Us explains "spatial resolution" and "horizontal accuracy & orthoimagery" well, which you might want to read now.
 Aerial photos are a standard part of the GIS base map because they show a great deal of detail that you can't see on a map, such as building locations, cars, trees and so on. The most visible differences between images is resolution. For example, some images are incredibly zoomed in (like 1"=100 feet)… where you can catch someone opening a car door! But the cost is very expensive, especially with horizontal accuracy. An aerial flight over a medium sized city like Roseville can cost several hundred thousand dollars (that's right). Some factors are necessary for accuracy: scanned imagery, heavy overlap, control points, and at the least a Digital Elevation Model (DEM).
To achieve horizontal accuracy, about one third of the cost involves removing distortion, i.e. inaccuracies caused by terrain. This is process is called "orthorectification" and often uses a DEM to represent the terrain. For a high level of accuracy, a Digital Terrain Model (DTM) is used, which is so accurate that you can see the shape of building pads and grading in a new subdivision.
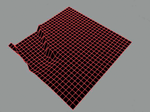
Digital Terrain Model
After creating a DTM, the aerial image is draped over this model and to match the terrain, thus removing distortion. Very sophisticated, and only the richest of cities such as Palo Alto can afford this "survey accuracy." For a city such as Denver with high rise buildings, a DTM is required because buildings and tall structures will "lean" significantly from distortion. As a result they obscure features such as intersections, manholes, and utility poles. To learn more about digital orthophotography, you'll read Stand up Straight - A True Ortho Perspective of Downtown Denver (See External Links to access it on-line.)
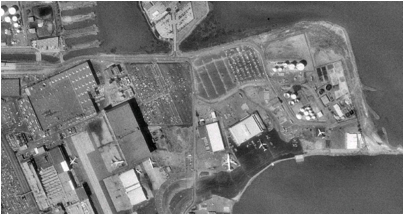
Digital Ortho Quad (DOQ) of San Francisco Airport
 Repeat Material
Some images are not "zoomed-in" with a coarse resolution (1" = 2000 feet). You can't really see cars, but you can see large jets on the tarmac. The most common and very inexpensive (often free) image is called a Digital Ortho Quad (DOQ). (Technically speaking, a DOQ is commonly broken into quarters quads called a DOQQ). The DOQs perfectly match USGS line data (called Digital Line Graphs or DLGs), which are commonly used for base maps in a GIS. The match so well because they are the source for making these maps. Your standard topographic (7 1/2 minute) quadrangle, in fact, are also updated using DOQs. So for a watershed scale, this imagery with its moderate resolution and accuracy work just fine…After all, USGS is the pioneer and industry standard of the mapping world.
One final point to make about conventional imagery is that it must be placed in the correct geographic space (georeferenced), otherwise it is just another pretty picture. For example, historic 8x10 photographs taken in 1940 of Dry Creek running through Roseville (which is of great value to see historic changes to the stream channel) is of no use unless it is georeferenced. First it must be scanned, then usually at least one corner of the photograph must have an exact known location, such as longitude and latitude coordinates. This information can be easily input into the computer via the GIS software, and then you're ready to add regular GIS layers on top.
Multispectral Imagery
Using satellites with sophisticated sensors, scientists can detect all sorts of biophysical and human activities on Earth that conventional imagery cannot sense. All types of materials on Earth, such as vegetation, rocks, soil, water, and urban infrastructure can be detected because they reflect and absorb certain parts of the electromagnetic spectrum.
Scientists, that is, know the sun's radiation emits a continuous stream of light energy from very small wave lengths (gamma, X-rays, and ultraviolet) to very long wave lengths (infrared and microwaves). Our visible light is somewhere in between. And because the electromagnetic spectrum reacts differently with Earth's materials, such as rocks mentioned above, we can identify their spectral reflection. This is achieved by processing the data with specific methods known as "algorithms" and filtering out all of the known distortion factors (and there are many of them). Then we can map the materials.
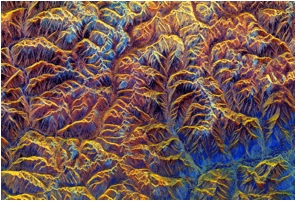 While the explanations for how these sensors work is pure mathematics, physics and even rocket science -- not to mention the dizzying amount terms and acronyms used --the imagery products are stunning. Indeed it is hard to ignore this technology and easy to understand their specific applications. Shown here is an accurate depiction of the Himalayan terrain using RADAR, which is a form of remote sensing. (Of course there is LIDAR today, which uses lasers for pin-point accuracy.)
Tibet mountains using RADAR - 56 miles east of Lhasa -- North is toward the upper left
(This image was acquired by the Spaceborne Imaging Radar-C/X-band Synthetic Aperture Radar (SIR-C/X-SAR) on April 10, 1994, on board the space shuttle Endeavour. )
I will focus just on a couple of case studies to illustrate multispectral imaging, which as you can see takes conventional imagery a step further. I'll also let pictures and captions tell the story. Here are a few applications from my cursory research: Ice mapping and monitoring in Greenland; monitoring oil spills with satellite imagery; studying critical habitat for sandhill cranes (the birds); flood plain mapping, agricultural crop monitoring, timber management, sudden oak death (mortality) of California's tanoak and coast live oaks, ecological change in the Zambezi Delta, flood plain mapping, and the list goes on.
 Zambezi Delta (Africa). Left is the mosaicked series of aerial photographs from 1960. Right is the 30 meter resolution satellite imagery from 1999. Aided with 1960 base map and landcover maps, can see landscape changes such as a decrease in mangrove and an invasion of palm and Acacia species, drastically reducing the habitat for cape buffalo, waterbuck, and wattled cranes. (GeoInfo Systems - May 2000)
Usually broader areas are covered (given the expense) by satellite imagery, but cost are coming down to cover such applications as impervious cover.
Here is an excerpt from a ESRI's white papers (http://gis.esri.com/library/userconf/proc01/professional/papers/pap827/p827.htm).
The amount of impervious surface area is by far the single most important factor affecting the amount of runoff in the urban environment. The City of Scottsdale, Arizona (COS) wanted to see if remote sensing could provide a cost-effective way to more accurately estimate this key input parameter. The City tried a different approach to the determination of impervious landcover percentages via the classification of high-resolution multi-spectral imagery using standard remote sensing processing techniques in conjunction with data from its Geographic Information Systems (GIS) database. The goal was three-fold if the remote sensing procedures proved accurate and reliable: 1) to determine actual impervious area in fully developed portions of the city, 2) to validate or correct the look-up table values [coefficients] for improving estimates of future conditions in the undeveloped portions of the city, and 3) to create a cost effective procedure that could be used periodically to update and correct the City’s hydrologic models as development occurs.
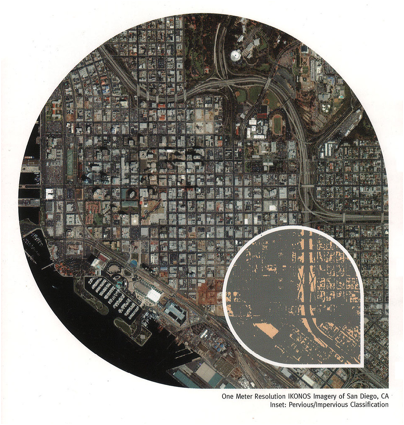
As you can see from the picture, the sensors can detect impervious cover by using sophisticated "image classification techniques, [and create] valuable information layers for urban planning, water-resource inventory, flood control and wildlife management. This approach is much more cost-effective and is made possible by recent advances in high-resolution digital imaging from aircraft and satellites." Space Imaging (www.spaceimaging.com -- by far the largest and industry leader in image classification)
One last example is the change detection project jointly conducted by the California Dept. of Forestry and Fire Protection (CDF) and the U.S. Forest Service Remote Sensing office in Sacramento. Tasked with the daunting job of monitoring vegetative changes throughout the entire State, which are often due to fire and logging disturbances, remote sensing is the only sensible and cost-effective tool to use. Basically the departments have set up algorithms to assess biomass change and produce maps such as that below. Every 5 years they update these maps and assess the change.
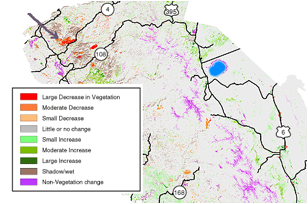
This is a map of the Sierra Nevada mountains near Arnold, CA. You can see in red the large decrease in vegetation from the Old Gulch fire of 1992.
We've just scratched the surface, but I hope you get an idea of what remote sensing can do for you.