Understanding Quantities
Ranking Quantities
ranking
counts and amounts
total and
tallied numbers
business mapped by number of employees
average
annual precipitation
number of dead and dying trees
ranking
ratios
average number of people per household
percentage of
population aged 18 - 29
percentage of available parking spaces
ranking
discretionary and qualitatively
(ranked categories)
streams ranked by recreational value
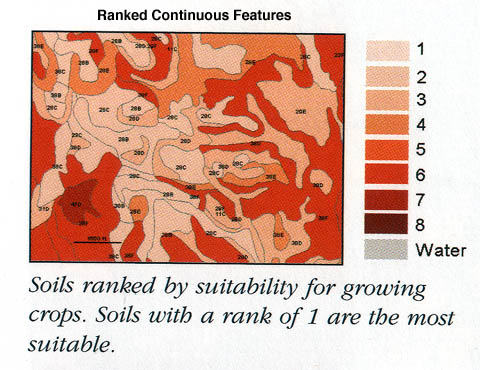
soils
capable of growing crops
fire hazard based on fire history, veg. belt, fuels, slope, aspect
Creating Classes (usually numeric)
grouping
counts, amounts and ratios to simplify
creating classes manually
logical break determined by person
35 % living below poverty line
50 % and below, 51 to 85, above 85 % forest cover
small, moderate, large extent for fire perimeters
standard classification schemes
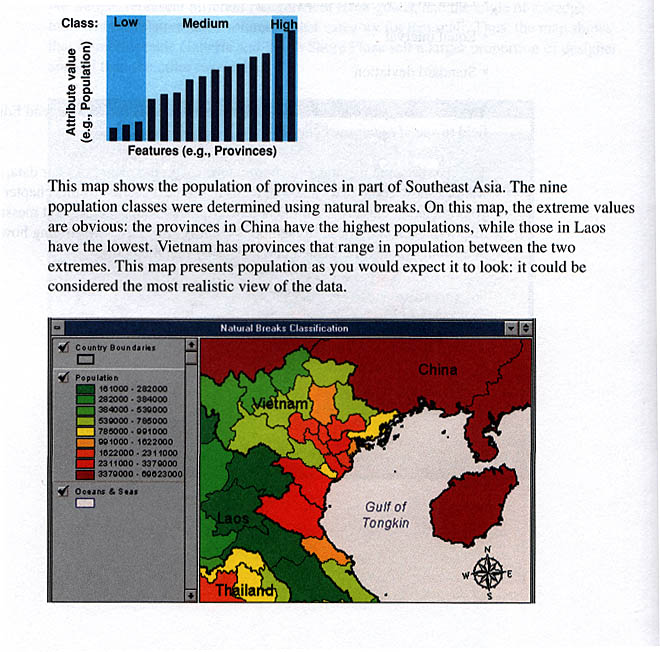
natural breaks
quantile
equal interval
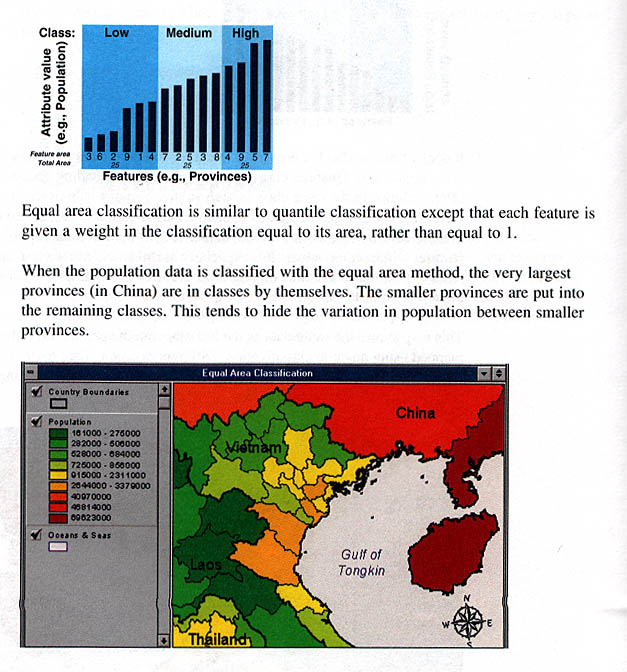
equal area
standard deviation
how many classes
dealing with outliers
extremely high or low values
result of error or skewed data
Index
 Understanding
Quantities Understanding
Quantities
Understanding
Quantities Understanding
Quantities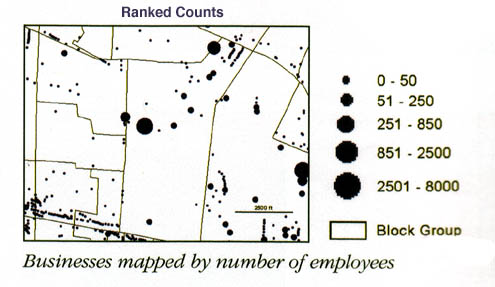