Abbreviated USGS Article
I have simply shortened this article because it's too long, expecially with the Digital Line Graph (DLG) chart & table. So here is the abbreviated version explaining the foundation of GIS layers used in so many maps today. Even the new technology companies like Yahoo and Google have borrowed from this massive project initiated over 100 years ago to map the United States by the U.S. Geologic Survey (USGS).
Digital Line Graphs

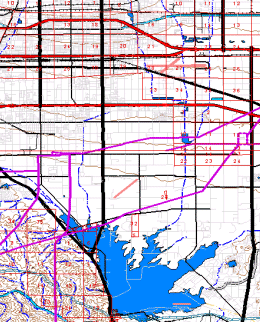
Digital Line Graphs (commonly known as "DLG’s) are a digital vector representation of the features typically seen on a standard USGS topographic map. Unlike a scanned quad sheet, which is simply a graphic image, these vector data sets can be converted into actual ArcInfo coverages. Each layer can be edited and cartographically manipulated, for example to update the alignment of a road or to change its display characteristics. DLG's are available three different scales: 1:24,000 (24K), 1:100,000 (100K), and 1:2,000,000 (2M). This section focuses on the 100K DLG product because of its wide availability. 100K DLG’s come in 5 separate data sets representing a total of 10 different data layers as listed in the table below. (Examples: roads, railroads, lakes, rivers, etc. Note an extensive table is in the original article... this is only a summary.)
The principle advantage of DLG’s is that they are the only seamless vector basemap data in the United States produced to meet National Map Accuracy Standards. This means that on a regional scale, adjoining map sheets will meet at their edges, and features will have uniform accuracy at scale. This is an important consideration in regional mapping applications, where uniform basemap data is needed to cover tens or hundreds of miles. DLG data also tends to have a higher resolution than comparable data sets of national scope. For example, coastlines and lake shorelines show a great deal of detail when compared to other more generalized data sets. In fact the term "100K" scale is somewhat misleading. 100K DLG data sets were originally compiled from 1:24,000 (24K) topo source sheets, and although certain feature classes were weeded out—for example vegetation and man-made features—others were retatined at virtually full resolution. For example in the DLG Transportation layer, road detail is retained to the level of residential streets
Digital Elevation Models
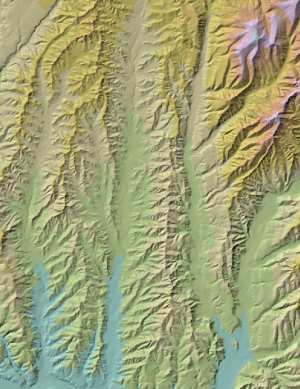
 Digital Elevation Models (commonly referred to as DEMs) are a raster-based grid of numeric elevation values. They are used in a GIS to produce three-dimensional terrain models. Because they are based on a raster data model, some products produced fromDEMs can appear similar to simple graphic images. For example, DEMs are commonlyused to produce striking shaded-relief images, which in addition to their visual appeal,are extremely useful for visualizing local and regional terrain features. But DEMs aremore than simple graphic images. They are fully georeferenced coverages and can beused to produce numerous spatial and analytical products. For example, DEMs can beused to produce maps of slope and aspect, and can be used to generate vector elevationcontour lines. They are also the foundational data set used in many terrain-based GIS modeling applications such as watershed modeling, visibility analysis, flood susceptibility, landslide potential, and wildlife corridor determinations.
Digital Raster Graphics

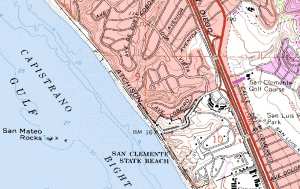
USGS Digital Raster Graphics (commonly known as DRGs) are scanned, geo-referencedimages of standard 7.5 minute USGS quad sheets. They are not vector coverages—theyare simply images—but they differ from a simple graphic picture in that they are georeferenced. When correctly projected, DRGs will "overlay" with all other GIS data layersin correct geographic space. The images are in full color and high resolution. In fact, plots of DRGs from an HP 2500 plotter are virtually indistinguishable from the original paper product
DRGs have a variety of uses. The most obvious is that, in digital form, color copies can plotted and distributed at will. Derivative products, such as project specific features overlaid onto the DRG and replotted, are easily produced. This is extremely useful for field personel such as surveyors, biologist, geologists, and so on who routinely use topo maps in the course of their work. [More in the actual article]
Digital Orthophoto Quarter Quads
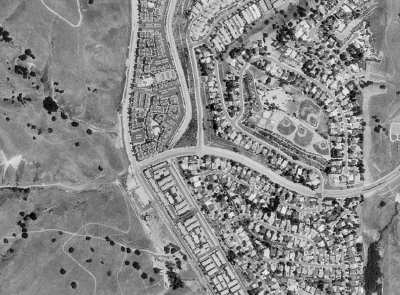
 USGS Digital Orthophoto Quarter Quads (typically called "DOQQs") are georeferenced, fully orthorectified, digital aerial photography. Because the effects of rotation, tilt and terrain relief have been removed they can be used directly for feature digitization and GIS data layer updating. They are extremely useful as an overlay for verifying, revising, and supplementing the information content of DLGs, DRGs, and DEMs. They are also an invaluable tool in the field as an aid to regional and urban planning efforts and environmental mapping projects. The imagery has a native resolution of 1m and will support plots to scales of 1:3,000 (1"=250’). Because file sizes are large (typically 50 megs for black and white and 150 megs for CIR), they are distributed as quarter sections (NW,NE,SW,SE) of a 7.5 minute quad sheet.
[Again, you will find more information in the actual article below, but for the purposes of this class, the abbreviated version gives you the basis for today's base map line work, terrain images, and now much more refined aerial photography.]